Summary
This case study describes an experiment in which EnFuzion helped evaluate control strategies for cattle tick, a major agricultural pest in Australia. Cattle ticks (Boophilus microplus) affect about one third of Australia’s cattle. The cost of cattle tick management is estimated at $150 million per year, due to lowered production and expensive control measures.
EnFuzion can help save money spent on tick control by contributing to the evaluation of tick control techniques and their results. Enormous savings can be made by optimizing the application of control measures and utilization of resistant strains. Optimal control techniques also can help reduce chemical resistance within tick populations and minimize residual pesticide levels.
What is TICK1?
TICK1 is a simulation code developed to study cattle tick ecology. It is a climate-driven, process-based, discrete time step (weekly) model of the population dynamics of cattle ticks. TICK1 incorporates models of various ecological and physiological tick development processes, including on-host survival, competition between ticks, and avoidance behavior in cattle.
Process rates are calculated as a function of a number of meteorological, pasture cover, and host-related variables. Herd composition data for Australia, obtained from the Australian Bureau of Resource Economics, are used to derive weighted average herd characteristics and stocking rates. A soil dryness index is derived from meteorological data by using a single-layer soil water model. Each simulation uses long-term average climate data and is run to equilibrium (ten years) after an initialization.
The model is written in FORTRAN 77 and uses the NCSA netCDF/HDF data file format to handle climate surface data and simulation output. A 50 km grid is used across Australia (2785 locations). Simulation inputs are obtained from a commercial geographical information system; these comprise climatic (rainfall, maximum and minimum temperature and evaporation), herd composition, stocking rate, and management strategy data. These data do not change across the scenarios considered in this article.
The goal of the experiment is to design a minimal-cost treatment strategy for all of Australia using TICK1. The researchers designed an experiment that varied TICK1 input parameters relevant to a cost-effective strategy, namely the timing, treatment interval, and number of treatments. They considered three treatments: organophosphate dip, pyrethrin dip, and vaccination. The researchers measured treatment effectiveness in terms of a single metric that combined the costs of reduced live weight gain and treatment.
In this case, four parameters are defined: the time of year in which treatment begins, the number of treatments after that time, treatment frequency, and treatment type. For example, a suitable treatment strategy might entail administering a vaccination at fortnightly intervals, up to five times, starting at week 15 of the year.
How did EnFuzion help?
EnFuzion allowed the researchers to run their data over 25 workstations quickly and effectively.
How was EnFuzion used to develop TICK1?
In the actual experiment, the researchers explored the following parameter values:
- Number of treatments = 3, 5, 7, 9
- Starting weeks = 8, 20, 33, 46
- Interval between treatments = 2, 5, 8, 12 weeks
- Treatment type = vaccination, pyrethrin, organic phosphate dip
In this study, 192 different jobs were run, and they were distributed across 25 Alpha workstations. The total elapsed time was 45 minutes.
In the actual experiment, the researchers explored the following parameter values:
- Number of treatments = 3, 5, 7, 9
- Starting weeks = 8, 20, 33, 46
- Interval between treatments = 2, 5, 8, 12 weeks
- Treatment type = vaccination, pyrethrin, organic phosphate dip.
In this study, 192 different jobs were run, and they were distributed across 25 Alpha workstations. The total elapsed time was 45 minutes.
The following plan file was used to control the experiment:
parameter idipwk label "Starting Week" integer range from 8 to 46 step 12;
parameter dtype label "Dip Type"
    text select anyof "nodip" "orgph" "vacci" "pyrth"
    default "orgph" "vacci" "pyrth";
parameter idipv label "Dip Interval" integer range from 2 to 12 step 3;
parameter year label "Year(s)" integer range from 1990 to 1990 step 1;
task nodestart
    copy run_tick1g node:.
    copy input.skel node:.
    copy t1param.skel node:.
    copy params/* node:params
    copy metdata/* node:metdata
    copy bin/tick1ghdf2.0 node:tick1ghdf2.0
endtask
task main
    execute mkdir hdf
    substitute input.skel input
    substitute t1param.skel params/t1param.dat
    execute run_tick1g input output
    copy node:output output/$year.$ndip.$idipwk.$idipv.$dtype
    copy node:dataset4.Z hdf/$year.$ndip.$idipwk.$dtype.dataset4.Z
endtask
The nodestart task copies the executable and various input files across to the node. The input.skel file contains parameter values which are read by the application on startup:
$year
 $year
 l
 3
 output
 '$year, $ndip, $idipwk, $idipv, $dtype'
The t1param.skel file contains ecological parameters used by the simulation:
'EPMAX' 2800.0
 'TEPMAX' 24.0
 'TEPL' 12.0
 'TEPH' 35.0
 'REDT' 0.002
 'TEDL' 12.0
 'RESD' 0.5
 'REST' 0.00000065
 'TESL' 50.0
 'ELSTR' 0.5
 'VR0' 0.161
 'VH' 0.0059
 'VT0' 24.0
 'VB' 0.33
 'P' 0.1
 'CSTR' 0.02
 'SFN' 0.2
 'HRLO' 0.1
 'PSURV' 0.04
 'GICRIT' 0.1
 'STRMAX' 150.0
 'IDIPFG' 0
 'DTYPE' '$dtype'
 'DIPE' 0.0
 'NDIP' $ndip
 'IDIPWK' $idipwk
 'IDIPV' $idipv
 'NTHR' 0
 'THRESH' 0
 'IHRDFG' 0
 'DF' 0.0002
 'ISRFG' 0
 'SR' 0.7
The main task substitutes the parameter values in the skeleton files and runs the application. The output files are then copied back for post processing.
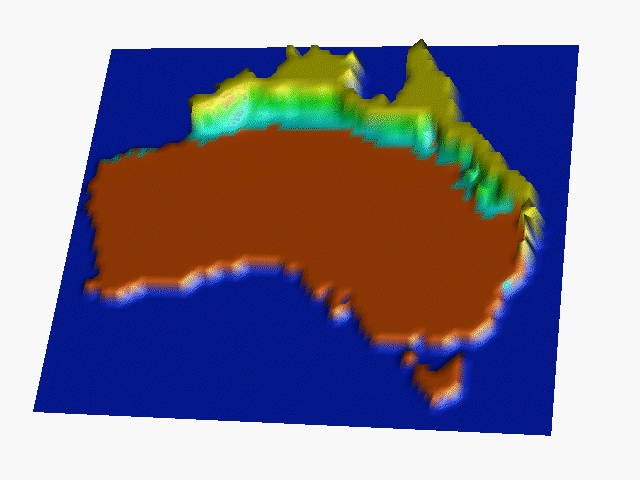
The following visualization presents some of the results obtained from the EnFuzion-managed TICK1 experiment, showing for each grid point the lowest cost obtained over all 192 scenarios. The maximum cost of $2.40 per head is found in the northern Australia (shown in green). The regions in central and South Australia with no cattle tick show a zero management cost (shown in brown). The most striking feature of the analyses is the effect seen in regions which border between areas in which ticks are treated and where they are not treated. These regions represent a cost of about $1.20 per head, and further analysis indicates that this is the cost of the cattle tick alone because there is no treatment administered in these regions. Please see [D. Abramson, I. Foster, J. Giddy, A. Lewis, R. Sosic, R. Sutherst, N. White, The Nimrod Computational Workbench: A Case Study in Desktop Metacomputing, to appear, Australian Computer Science Conference (ACSC 97), Macquarie University, Sydney, Feb 1997.] for more details and conclusions.
Further Information
This case study describes some basic capabilities of EnFuzion. You can find out more about using EnFuzion from the EnFuzion User Manual.